HERE we are, at the start of a new year already – doesn’t time fly! Before making goals for the year to come, first we want to reflect on the wins of 2024 in this Year in Review.
As always, please keep sending through your feedback – we hope you enjoy this breakdown of how Vizall has progressed and how it can help you!
1. Geocoding (more exciting than it sounds)
It is an incredible achievement that today we can throw text into a platform like Google Maps and within milliseconds we can understand if that represents a place somewhere on the planet. This was impossible only decades ago.
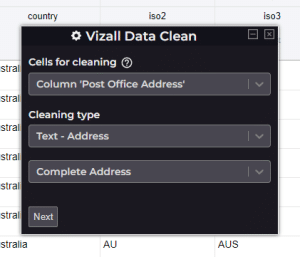
This magic is called ‘geocoding’, and we wanted to bring it into Vizall. We want you to have confidence that the addresses in your spreadsheets are valid. We don’t want you to have to plug them into Google Maps one-by-one.

Geocoding is usually a time consuming or very expensive task. However we have made it possible to use Vizall’s data cleaner to check and validate a column full of addresses, which then nicely leads you into easy creation of a second major addition to our platform this year: Point Maps.
2. Point Maps
POINT maps are great for visualising addresses on a map, whether that’s house listings, schools, office locations, parks or other points of interest.
After Vizall checks all of your addresses are real places and gives them some behind-the-scenes coordinates, they can be automatically plotted onto a point map like the one below.
Launching this complex feature has been a huge goal for our team for a while, so we’re excited we were able to deliver it to you in 2024!
3. Launched data literacy consulting
We kicked off a new area of Vizall: One-on-one or group consulting and coaching! Clearly our team can’t get enough of data, plus we want to see everyone confident working with numbers, so this shift into advising felt natural.
You can find out more about that and register your interest on our Consulting & Coaching page.
4. Added school zones to our interactive area maps
For anyone working with education data such as enrolment numbers or student absences per zoned school, this new type of boundary for our area maps could be exactly what you need.
There’s an example area map below, but all you need is to upload a spreadsheet containing at least one column with schools from an Australian state or territory.
5. Bye-bye bugs
As new features roll out there’s always room for problems to sneak in, so we’ve been busy as usual this year squashing bugs to continue refining your experience working within Vizall. Reliability is so important to us, so we are very grateful when you get in touch at contact@vizall.com.au to report problems.
We look forward to navigating 2025 with you
Our goal is to make data visualisation easier than ever and provide you with tools and tips to get better insights with confidence, even if you’re not a trained data analyst.
As we wrap up the year, we want to say a huge thank you for allowing us to be part of your data journey! We’re looking forward to what this next year has to bring.