Clean Data.
Discover Insights.
Create Graphics.

Clean and analyse data to download or share through beautiful maps and tables. Work entirely on the web, no software or coding skills required.

Clean Data

Step through our data cleaner to spot trends, summarise findings and fix errors like misspellings and bad addresses.
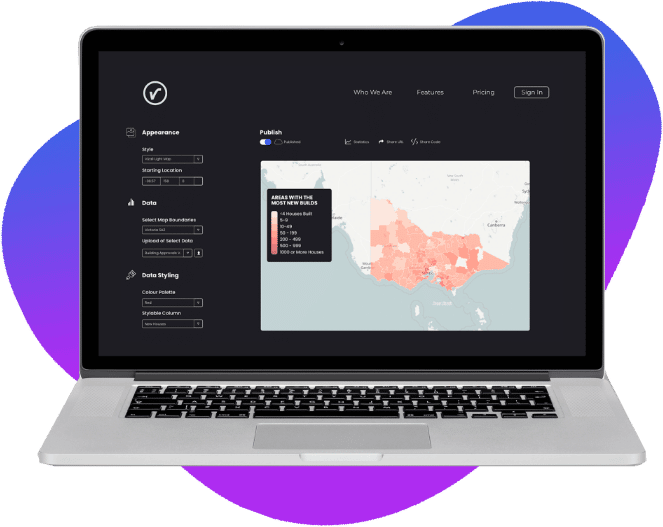
Discover Insights

See your cleaned data come to life with easy-to-use and customisable visualisations.
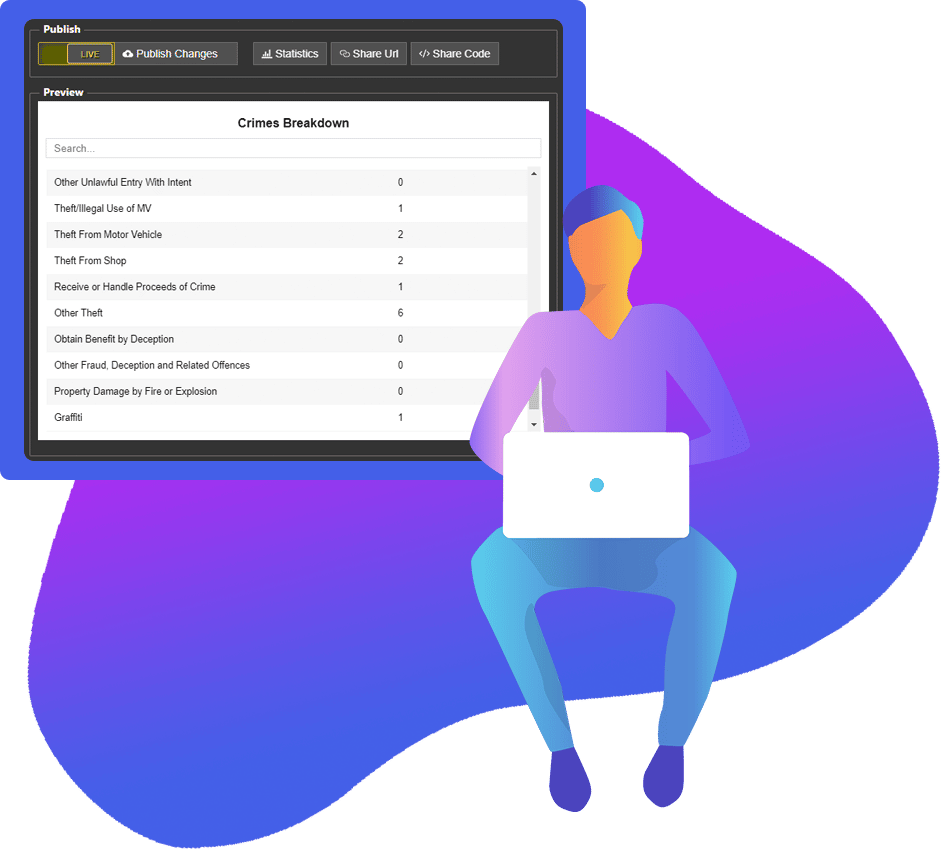
Create Graphics

Publish and embed, or download the cleaned data from step one ready for your own data analysis.

Captivating Maps

Vizall began from a need for easy data analysis and map creation using Australian geographical borders like suburbs, electoral boundaries, postcodes and council areas. Easily design your graphic with flexible colour palettes, text boxes and legends.

Captivating Maps

Vizall began from a need for easy data analysis and map creation using Australian geographical borders like suburbs, electoral boundaries, postcodes and council areas. Easily design your graphic with flexible colour palettes, text boxes and legends.

Create Searchable Tables

Choose from regular tables or add a search bar for complete simplicity when there’s many rows of data. Customise column titles and sort the data. Embed with ease using the Publish button and make changes as often as needed.

Data Cleaning Made Easy

Upload a spreadsheet, grab a coffee and let the data cleaner guide you through fixing errors and formatting issues, validating addresses and calculating statistics, ready to download or transform into a graphic.

Instant Data Insights

Read a summary of your data for use in your news stories, reports and research, including totals, average, minimum, maximum and more.