
General
Why is my data taking a long time to load?
If you’re uploading large datasets (eg more than 50,000 rows) it can take up to 10 minutes to upload your data. A slow internet connection will also contribute to a slow upload time.
Consider whether there’s anything you can delete from the dataset to shrink its size. For example, if you’re not planning to use all of the columns, delete some. Remove rows if you don’t need them, such as dates outside of your interest date range or locations you aren’t interested in for your analysis.
What happens to my charts if I cancel my subscription?
If you choose to cancel your subscription your published visualisations or searchable tables will continue to be visible to the public. If you wish to unpublish data visualisations after cancelling, reach out to contact@vizall.com.au and we will remove them for you.
Data Cleaning
Why are so many addresses unknown in the data cleaner?
That can happen if the address doesn’t exist yet, for example if you’re looking at new home constructions or development applications.
We’re investigating ways to deal with unknown addresses better. For now here are some tips to get around it:
- Open Google Maps in a new window and find the closest real address to the point you need, then copy/paste that over the top of the unknown address you’re replacing;
- Depending on what your end goal is, group the data by suburb/postcode etc, and visualise that on an area map, eliminating the need for precise addresses;
- Allow the data cleaner to change the unknown address to another address on the same road. This may not be the best option for you though if precision is important.
Why didn’t the data cleaner identify my location column correctly (ie wrongly identified suburbs, postcodes, etc)?
This can happen when:
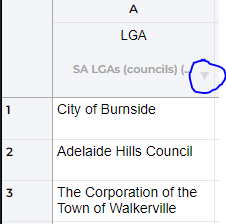
- You are using a boundary type that isn’t yet compatible with Vizall. Supported boundary types include LGAs, suburbs, postcodes and Statistical Areas 2-4. Please note that due to their size, suburbs and Statistical Area 2 can only be visualised at a state/territory level, and not for Australia as a whole;
- There is a mixture of data types in your column (for example suburbs and council areas). If this is the case, you will need to remove the unwanted data type and then re-estimate the columns by clicking on the dropdown and clicking re-estimate. When you’re done, run the data cleaner again.
I have rows of data with duplicate locations. How will they be treated when I create an area map?
At this stage, when the map is created only the first instance of the duplicate rows will be used. We’re currently working on ways to easily aggregate or delete duplicate rows.
To locate duplicates, click View Statistics in the data cleaner and scroll to the Top Occurrences section. You can use this list to find the corresponding rows in your spreadsheet and delete the unwanted duplicate.
Alternatively, with a paid subscription download your spreadsheet from Vizall, open it in Microsoft Excel or Google Sheets, and use a Pivot Table to join/aggregate the duplicate rows, then upload it again. For more advice on how to do this, reach out to us at contact@vizall.com.au or ask us a question on the Facebook community.
One of my text values was wrongly corrected during automated data cleaning. How can I prevent this?
While we have endeavored to make the data cleaner as accurate as possible, there is always room for the introduction of error when automation is involved.
To get around this, we recommend you spot check the changes the data cleaner makes against your original, unedited spreadsheet.
Visualisations
I have used the data cleaner and created an area map but there’s no data showing on the map. What should I do?
There are a few steps you can take if the automated map creator hasn’t worked as anticipated.
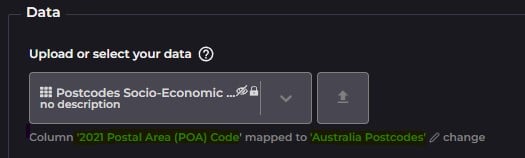
- First, on the map editor page in the Data section, check your spreadsheet’s location column is matching up against the right built-in location column. Please refer to the highlighted text in the image below as an example.
If the locations are mismatched, click change to open the settings and manually change them. For help, reach out to contact@vizall.com.au.
- If everything looks normal above, go down to the Appearance section to check the settings. The column you wish to focus on for the visualisation should be listed in Area style column.
- The last place to check is Area style rules. Sometimes the automatic column buckets don’t work properly. Click change and manually alter the values associated with each map colour and see if that solves the issue
- If none of the above solved the problem please reach out to us at contact@vizall.com.au.
What kind of charts and maps can I create with Vizall?
At this stage you can create searchable tables and area maps (also called regional or choropleth maps) that can be shared or embedded online. As a paid user, you can also download the spreadsheets you have cleaned in the automated data cleaner to continue further analysis if you wish.
Security
What is your approach to data security?
We take data security very seriously. This includes both your personal data and the data used to create visualisations. All data in transit is encrypted and database access is locked down. All private user data is protected and secured by AWS (US) and is inaccessible to systems/processes other than the Vizall application itself.
How is sensitive data protected in Vizall?
User data is secured by AWS (US) and encrypted in transit. We take the protection of your personal data very seriously, and if you wish to have it removed from our database at anytime please reach out to contact@vizall.com.au.
Please refer to our Privacy Policy for more information.