
Vizall helps non-data professionals make sense of their spreadsheets, find stories behind the numbers and turn them into beautiful visualisations.
Below are some examples of how Vizall might be able to help you in your industry. Everyone who signs up gets access to the Facebook community for professionals and students alike to ask questions and share knowledge.
Journalists and newsrooms
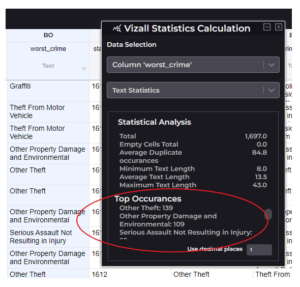
- Using Vizall’s stats tool to get a summary of a column’s average, maximum and minimum, most frequent words used and other insights to help you find story ideas in your data
- Turning addresses into valid locations
- Fixing spelling errors in suburbs, bad number formatting and more so you can focus on writing the story
- Visualising data on interactive maps or in searchable tables to embed in stories
Newsroom Example
Crime journalist Matt downloads the latest crime dataset showing different types of crimes for the latest financial year broken down by suburb.
This is a big dataset and he notices spelling mistakes in some of the suburbs and badly formatted offence dates. It would take him hours to fix it up and get any useful insights from it if he did it manually.
With Vizall, Matt can upload the data and quickly fix the errors in the automated data cleaner, open up the stats tool and get some quick insights about the data.
He discovers the most common crimes across the city are theft, property damage and serious assault without injury (see the circled section of the screenshot above). Scrolling down reveals the full ranked list.
In less than 10 minutes, he has preliminary facts to start building out a story. He can then quickly and simple turn his data into an interactive map to share with his readers.
PR Practitioners & Marketing
- Using interactive maps to show gaps or hot spots in market
- Using the data cleaner to fix badly inputted or unrecognised client addresses
- Creating lists of clients in searchable tables that make it easy to locate names, locations and more with the search function
- Using a publication’s user locations on a map showing places with the highest engagement and more
Other Sectors
Real Estate
- Using suburb or council based real estate data to show median house prices, hot areas to buy in and more on an interactive map
Banking
- Creating content for blog posts such as interactive maps and tables with information about housing or financial markets
- Using data cleaning and interactive maps to conduct internal research about markets, mortgages and other customer related data
Not sure where to start? Reach out to our team at contact@vizall.com.au and we’ll help you as best as we can.