

REAL ESTATE agencies have access to a wealth of data with potential for understanding markets and connecting with the community in new ways.
As one of the most competitive industries it’s essential businesses are finding new ways to stand out. Thanks to advances in technology, real estate brokers can uncover insights about market trends, buyer behaviour, property value and more.
Here are some of the potential use cases of big data across your real estate company:
Predictive Analytics
Analyse historical data to predict future trends and make informed decisions about buying and selling properties.
While software is available that can make these predictions for wider geographical areas, it can be beneficial to use predictive analytics for local markets, partnered with an agent’s unique expertise and context for an area.
Customer segmentation
Target marketing strategies with customer segments based on purchase and listing history, demographics and more. Through the process it’s also helpful to create personas to understand the target customers better.
Segmentation with data also allows businesses to make better house recommendations to potential buyers.
More accurate property valuations
With the large amounts of data available it means agents can make better property valuations and judgement about investment potential.
With sales history data, you can compare prices for similar houses across the area, sold within your agency and also by your competitors.
Engage more with your social media followers
Improve email and social media communications with your network of investors and potential buyers. Agents can share market insights with their social media followers, and send tailored emails to former and potential buyers.
You can read more about real estate industry data analytics in this detailed article by Predik Data-Driven.
Vizall for real estate agents
If you or someone on your team has basic spreadsheet skills and enjoys trying new tech, Vizall is a simple tool for getting more insights from data without coding or advanced data analytics skills.
Use interactive maps to engage more with potential customers
You can easily create an interactive area map like the one below (also called a Choropleth map) to embed in blog posts or share on social media.
If you have data such as median house prices, rental yield or median rent, broken down by suburb, council area or even postcode, you can easily turn that into one of these maps to help potential buyers find areas with the greatest purchase or investment potential within their price range.
You could get creative with a combination of metrics such as occupancy rates, proximity to business hubs, number of schools nearby, retail outlets and crime statistics to showcase desirable areas.
See our blog post on how to build interactive maps in Vizall
Discover insights to share with your team or the community
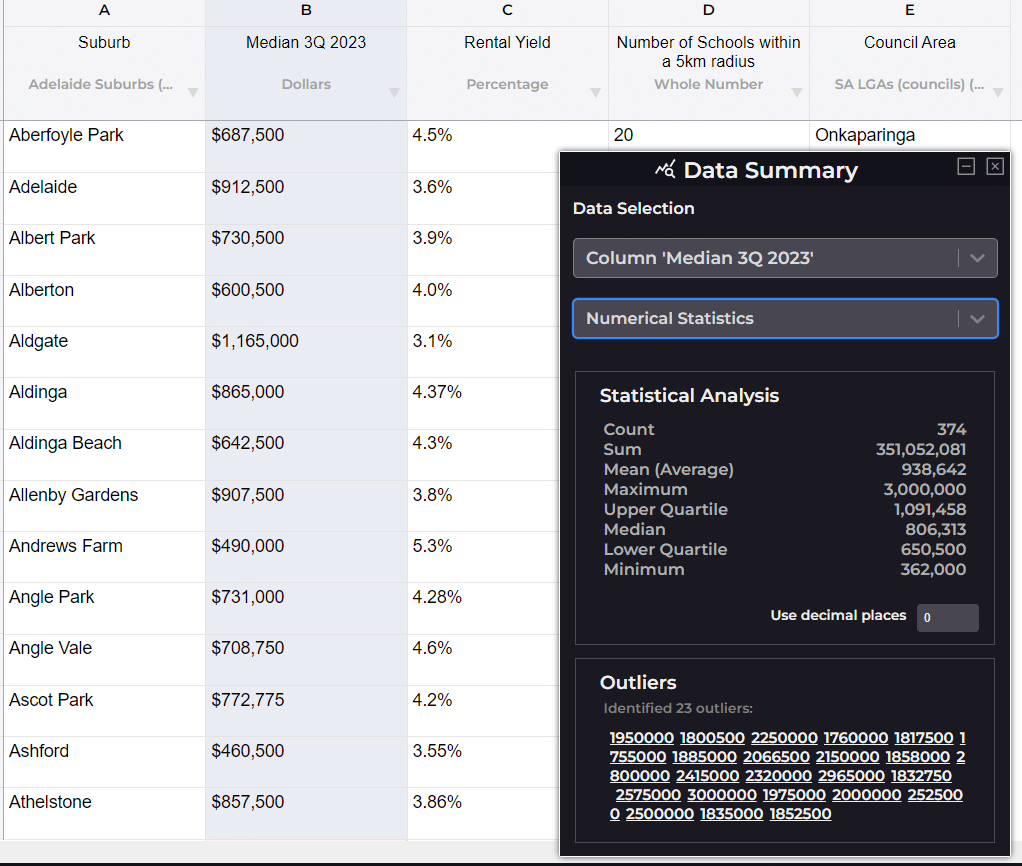
After uploading your spreadsheet into Vizall you can use the data cleaner to correct spelling errors or inconsistencies in dollar or number formatting, then get a quick summary of the key features of each column.
For example, you can see the average, median, minimum and maximum values in a numerical column, or take a look at the list of outliers to find potential red flags or story angles for your next blog or social media post.
In a text column, you can also take a look at the most frequently found words.
Create searchable tables for blog posts or to store and share internal records among your team
Present large amounts of data in a simple way with easy to build searchable tables. Potential buyers can search through the table to find valuable information about schools, crime, or other information about their suburbs of interest.
You can also create tables to share among your team, for example important contacts or addresses.
See our blog post on how to build searchable tables in Vizall
Elevate your team’s skills with Vizall data literacy coaching or consulting
If you’re keen to upskill your team with data literacy skills and knowledge you may wish to enquire about our coaching or consulting programs. This program is all about making numbers relatable, finding insights, creating visualisations and telling engaging stories with data.
Find out more about our personalised data literacy coaching and consulting services