real estate

An example point map created in Vizall

How to make point maps: Visualise places of interest and more

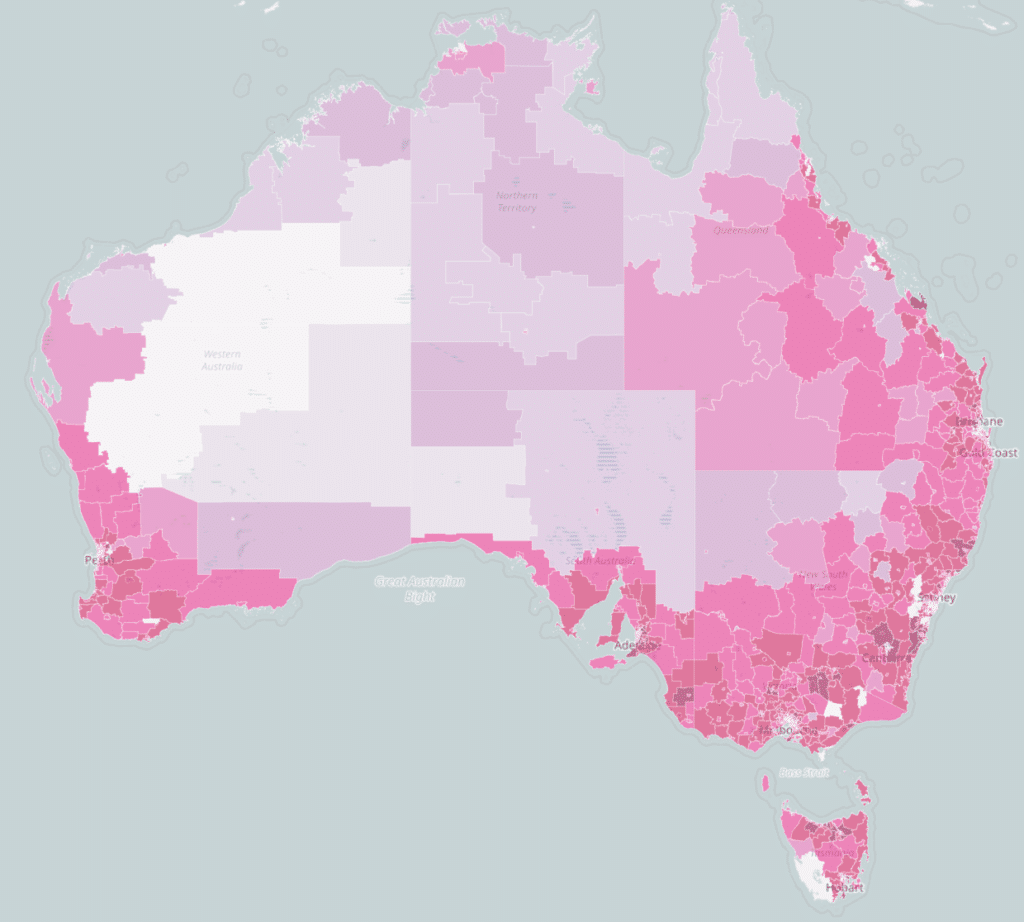
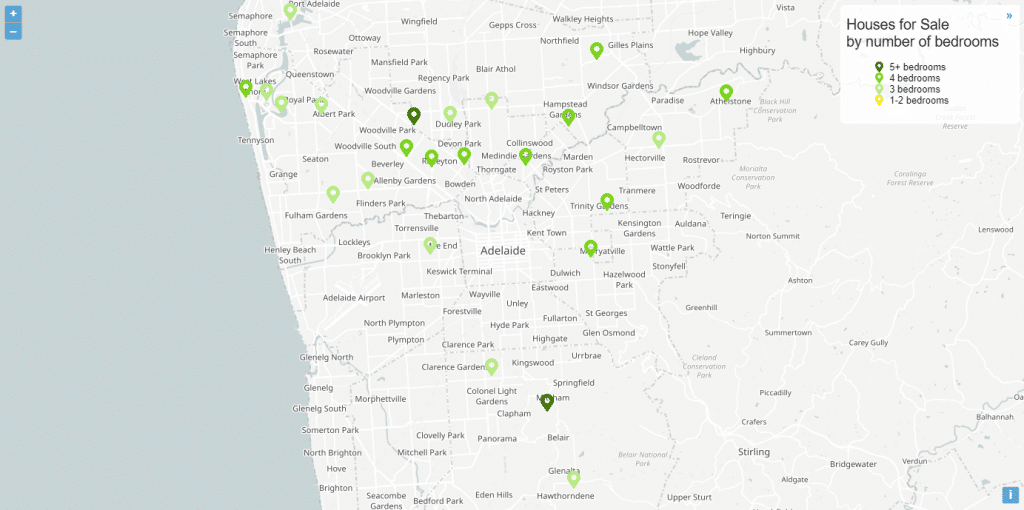
POINT maps are a fantastic way to visualise data, such as house listings, schools and other points of interest on a map. They can be published to a wider audience online, or tailored for specific clients. Recently we launched point maps as a new feature in Vizall. To make one, simply create a free account, …

How to make point maps: Visualise places of interest and more Read More »

Point maps are here: Visualise house listings, events and more

Point Maps are here! This has been an aspirational goal for the team for a long time. We are excited to finally show off what can be done with this new feature. To get point maps into Vizall there were three important changes we needed to implement. Address data type & validation (geocoding) – this …

Point maps are here: Visualise house listings, events and more Read More »

Geocoding: Using Vizall to fix and turn a street address into a point on a map

Hi fellow Vizallers! As the tech lead here at Vizall you won’t see my name appear on too many articles, but I will occasionally post about exciting tech changes or major bug fixes when necessary. Today we’re discussing addresses, but before we do, I’ll quickly explain an important part of data cleaning with Vizall: understanding …

Geocoding: Using Vizall to fix and turn a street address into a point on a map Read More »

Photo by Tom Rumble on Unsplash

How real estate agents can connect with customers using big data

REAL ESTATE agencies have access to a wealth of data with potential for understanding markets and connecting with the community in new ways. As one of the most competitive industries it’s essential businesses are finding new ways to stand out. Thanks to advances in technology, real estate brokers can uncover insights about market trends, buyer …

How real estate agents can connect with customers using big data Read More »

Vizall data visualisation example

Best free data visualisation tools in Australia in 2024

WHETHER you’re a beginner exploring data visualisation options or an expert, there’s plenty of free tools available to help you craft a narrative backed with compelling data. Here’s our pick of top tools for creating charts, interactive maps and tables. Most are international brands, however they have all been tested and identified as suitable for …

Best free data visualisation tools in Australia in 2024 Read More »